Sunday, December 23, 2012

MINERS AT A LOW!!


The history of the stock market reveals how specific patterns come into being, and how it influences subsequent behavior. Pattern sequences of a previous time are reborn and under the right circumstances, can identically repeat. It is simply a reproduction of how investors are behaving collectively at two different points in time. But knowing that a pattern has a particular script it follows can constitute a path that holds (or leads to) a likely outcome!

Ninety percent of the time all market declines will have two panics. The first is associated with volume and volatility, invoking maximum participation. The second is a byproduct of the first and unfolds in a final ‘flush out.’ It is less dramatic in size and influence- but prices reach new lows.

Time is also a component and is equally as important. Once a protracted decline sets in, historically there is not a typical short squeeze of five to eight percent in the other direction, but a tremendous upward spike which reverses the trend all together.

The modern day scenario that is most fitting is of course, the GOLD MINING INDEX. And after an extended three month correction, we can officially say "the rubber band has been stretched!" The technical picture provides enough evidence to define a clear cut two- panic low sequence, but more interestingly, the second panic has a particularly complex nature that morphed into a sideways and seemingly base pattern. This now calls for a violent uptrend underway!
GDX-Daily Chart (click to enlarge)

The CC Report offers two subscriptions- $9.95/month or $100/year. It is well worth the information received.

Darah

Saturday, December 8, 2012

PANIC COMING!


The TV pundits all contribute their fair share to the conditioning process by clouding thoughts of any market player. To the extent that all ambiguities presented will bait investors to thinking IRRATIONALLY! Like, waiting for a 1000 point rally to emerge once the fiscal cliff is resolved.

Fortunately, underneath all the headlines a visual and graphical interpretation can be mathematically extracted. It is here, in these very charts, where you will find an answer that illustrates what is really going on, so that us technicians can observe, scrutinize, and formulate a particular bias.

The information provided does not tell you why, or when, but what!

In this case, ‘the what’ is a bear market rally. These particular rallies are very sneaky and most convincing, but can be properly identified when using the right tools.

For starters, a basket of heavily weighted companies, ‘THE NIFTY FIFTY,’ which offer the bulk in the performance in the averages -all now have chart patterns that cannot sustain the continuation of this advance. Invariably, when volume remains light during an extended window of time, the result is an inevitable sharp collapse back down to the previous lows or worse, new lows that can no longer support a bull market.

The S&P 500 index is a case in point, which is still in rally mode, and perhaps can continue higher if there is further consolidation. But if only mother market is ever so accommodative to our own expectations.

And it is because of her complexities that make it an impossible arena for perfection. The current rally back is clearly overworking itself to recapture the previous drop in November and rather than guessing where exactly it will end, think of it in terms of direction. The future course of these violent counter trends ultimately end in a scare plunge; and all the pumping in the world cannot uphold the violent cascade of selling pressure that will implode on the masses.
Consider the technical chart below, which projects a disaster waiting to happen, and with only a small chance of one last leg higher before this rally is all said and done.
S&P 500- Daily Chart
 

The CC Report offers two subscriptions- $9.95/month or $100/year. It is well worth the information received.

Darah


Saturday, November 17, 2012

OVERSOLD RALLY COMING!


The ever changing nature of the stock market will often boggle analysts if the current price information displays an unclear message. There has always been, and there will always be a fascination to wrongfully challenge what the future holds, instead of interpreting what’s at hand.  It’s as if what is already known is simply not enough.

Such aspects should never be the primary tool of one’s own decision making. In fact, this is very reminiscent of my encounter with one wise expert on Wall Street. He is a seasoned grizzly who has weathered decades of all different market climates and his ever influencing demeanor once expressed to me, “Don’t tell the market... let the market tell us!”

Many have already come forth with bottom expectations, but none hold any convincing basis for this belief. With regard to the averages, the message across the board is simply no message at all. The only, if any, ‘take away’ from this most recent emotionally inspired wave of selling has served as an oversold condition. No reversal has transpired to even consider a change of events.

BUT, the last thirty minutes into Friday’s close did reveal a heavy interest of buying for reasons we will soon find out next week. Any follow through of this will result in a swing low, but I must caution those who feel this may in fact be the more important bottom. Let me explain.

Even in the perverse of markets, rarely do stocks ever go down and then turn back up to form a ‘v-bottom.’ These particular bottoms are suspect and almost all fail. A true bottom worthy condition must present a subsequent retest of the low or in the very least, find support near the general area to confirm that prices can hold despite all of the bearish news.

Bottom Line:

After a second low is presented, odds increase tremendously for an oversold rally into year end. Leading into the second low, divergences will erect on all fronts and most of the selling pressure should be ‘wrung’ out. Below is several examples to further underscore this very sequence.
NDX 100- Daily Chart
 

In case Friday was not a low of some kind, a bottom will soon be realized in the coming days.


The CC Report offers two subscriptions- $9.95/month or $100/year. It is well worth the information received.

Darah


Thursday, November 15, 2012

A Free Lunch!


Click on the link below to preview a sample of the Nov.5th Premium Newsletter.

11.05.2012- Sample Newsletter


For a more comprehensive analysis on the markets, please go to the Premium newsletter tab and subscribe today.

Darah


Sunday, November 4, 2012

A SECOND CHANCE FOR ALL GOLD INVESTORS!


Not long ago, in the article entitled, “The Final Run in Gold,” I outlined a sequence of specific events that called for an imminent correction in Gold. Contrary to this viewpoint, the pervasive narrative among analysts at that time was forecasting the metal price to reach as high as $2,000 an ounce. Of course, this expectation never came into fruition, nor was it rational enough to give any credence either.

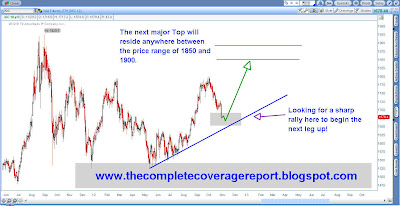
For those of you who are owed back the explosive rally in September NOW get a second chance. Prices are in their final days of this current decline, and will present buyers with one extraordinary opportunity. My target between 1850 and 1900 I see can be realized in the coming 4-6 weeks, likely leading into mid December. All it will take is a one day stroke higher of 20 to 25 points that initiates the reversal, and which generates an avalanche of buy orders thereafter.

As you all know, psychology in the commodity markets is driven by the element of FEAR, but this time it will be BULLISH PANIC. The truth of the matter is that Gold is in a roaring new bull market. And these hyper-sold conditions trap investors because they are emotionally forced to sell their positions at the very wrong time. Bottom fishing to this degree where valuations are extremely suppressed is not an occasion that comes very often.
The canvas below you will see I’ve ‘inked’ with my long expectation of the price action in the yellow metal. Don’t get left behind as the train is not far from leaving the station.

The CC Report premium newsletter is a daily update for subscribers. One can join this particular service for only $9.95/month or $100/year. It is well worth the information received.

Darah

Saturday, October 20, 2012

GOLD AND MINERS ARE APPROACHING BOTTOM!


Large concentrated amounts of volume will appear during the intial stages of an uptrend, which is a telling sign of forthcoming strength. It is a direct result of INSTITUTIONS that accumulate massive long positions at the start of a major move. But as time 'takes a toll' on the maturation of the bullish advance, its trend grows weaker on diminishing amounts of volume even when the stock is making new price highs. The interpretation is that investors are losing interest, and a top is near.

Likewise, in the case of a downtrend, new price lows on declining volume indicates that buyers are ‘eating up’ the supply, and the trend is ready to reverse. There are even occasions where the reversal transpires as a ‘volume spike’, but you see very little price movement.  The message is that the extremity of selling pressure within the move lower has reached a point of exhaustion.

Based on the corresponding characteristics exhibiting in both Gold and the Miners, there is overwhelming evidence that supports their current down trending structure to be coming to an end. Let me explain.
 
The yellow metal has now entered the accumulation phase, where big firms initiate a ‘scale in’ approach to purchase blocks of millions of shares over a designated time frame. Since legally they cannot buy the entire shares float all at once, this strategy is widely used and seemingly more appropriate. Furthermore, the lack of selling participation associated with Gold’s most recent price decline, on top of the new money inflow, suggests that buying is in effect.
 
If this methodology happens to 'stretch' the actual turning point as sometimes is the case, my guess is that by the next 5- 8 trading days a bottom should present itself. Rarely do you see a correction last more than three, three and half weeks especially in the birth of a major uptrend.


Particularly when an index is so closely linked to the metal it tracks, yet is sensitive to the price performance of the overall market, its true direction can be skewed by such 'pulling' forces. Despite a 200 point drop in the DOW JONES Average on Friday (a mild re-enactment of the 25th year anniversary of Black Monday), and gold moving lower- the GDX actually closed positive on rather large ‘spike volume.’ This is a clear case of Investors that have seemingly found attractive valuations at current levels for reasons obvious - they are expecting a bottom.  


The CC Report premium newsletter offers two subscriptions-$10/month or only $100/year. It is well worth the information you receive.
Darah


Saturday, October 13, 2012

A YEAR-END RALLY IS SOON UNDERWAY!


The integrity of a particular resistance level at which prices breakout from is only called into question if the subsequent retest lacks the ability to ‘hold’ above the breakout point. Failure to do so would be a sign of trouble that requires more effort among buyers to ‘absorb’ the oversupply of shares at hand. However, the fact that market fluctuations can be irrational at times; there are cases when the breakout level is not necessarily the fulcrum point. Instead prices have room to ‘give’ but still remain above the general stopping area. This can be equally as valid so long as there comes a period of consolidation 'above' where buyers can defend the newly established higher level of support .

For this technical reason one might objectively identify as their being a potential bullish case in stocks right now. And should this analysis be applied to the basis that 'the fundamentals always find a way to fulfill the technicals,' then it gives even more reason to ‘dig’ into what might be the primary driver.

For starters, price action during the month of September was largely ignited by investors’ response to the stimulus measures of our Federal Reserve. Not only was there a great deal of ‘front running’ the announcement of QE3, but as it turns out, the actual announcement was a ‘sell on the news’ type of event.

Since the market has not ‘taken off’ as it seemingly should by now, there is somewhat of a dismissive approach among investors- as if money printing this time around may not ‘work’. Historical evidence would prove that monetary stimulus during the latter stages of a bull market cycle has less desirable effects, but for reasons explained in the premium newsletter- I believe there is STILL enough 'kick' in this market to accomodate a year-end/election rally prior to a major TOP.


The premium newsletter offers a variety of information on all asset classes of the stock market, including low risk/high probability strategies. Subscriptions are either $9.95/month or $100/year. It is well worth the information received.
Darah


Saturday, October 6, 2012

THE FINAL RUN IN GOLD

If ever an up-trending market is without a health restoring correction process, investors seemingly have leaned too far to the side of one bias. Generally the result is an ‘approaching top’. This might be the case now since Gold is contained within a sideways structure; a pattern that represents indecision and lack of direction. But under different circumstances, particular price behavior of this kind can presage a grimmer outcome.

The extended condition of Gold has a trajectory that speaks to more bearish possibilities, and not the bullish ‘hype’ that currently orbits our trading universe. Since these patterns are tricky, one cannot be certain of which direction prices will break-so key will be to follow the dollar.
 
If the dollar breaks its previous swing low, then gold will likely stage a mild advance to the neighborhood of 1815, 1840 max. Anything past that will be given back rather sharply as the metal is ‘overdue’ for a more substantial correction.

Should Gold break down from this ‘up and down’ pattern, then the initiation of a 2 to 3 week corrective phase has begun. I would anticipate the preliminary stage of the move lower to be a quick drop that is followed by a sideways consolidation. Thereafter the metal will stage an upward advance of much greater magnitude than this current one, likely pressing the September of 2011 highs at roughly $2,000 an ounce.


Traders/investors who ‘missed out’ on the August/September multi-month advance might be looking to reposition for what I believe is going to be an extremely lucrative opportunity. One can subscribe to the premium newletter for a detailed description of the expected sequence of events as well as particular points of entry.

Darah


Sunday, September 30, 2012

YEAR-END RALLY!


Typically at final tops is an oversold rally among the Dow Components and flagship stocks that ‘juice’ the broad averages higher, but few of these individual names actually make new stock highs.  The implication is that investors will hit the ‘EXITS’ just prior to the ‘you know what’ hits the fan, but suckers in the public for what they feel is ‘a runaway move’. This course of action is identically repeated just weeks before the end of every major bull market top - simply because it takes a great deal of time for institutions to unload blocks of millions of shares to those buying in at these euphoric levels.

The illogical nature of the stock market should remind us that there always comes a time when investors will forcibly convince themselves (under some unfounded reason) - to gobble up shares of any company,   not knowing the stock is rising - because it’s being squeezed for its every last penny!  This certainly is the case with Apple, Google, and Amazon. But of course, they will top out just before or with the market as I previously explained.

Fortunately, there is still plenty of time before any of these meaningful signs of trouble - bubble to the surface. And while there are subtle warnings that are current, they do not provide any serious sign to worry, at least not yet.
Simply put, the stock market is set in motion to resume its year-end uptrend before the culmination of this four year Bull market cycle. And soon after this current decline bottoms out, it will be the very last worthwhile position for longs to accumulate shares into the final quarter.


The CC Report premium newsletter offers two subscriptions-$10/month or only $100/year. It’s well worth the information you receive.

Darah

Sunday, September 23, 2012

EYE OPENING BULLISH POSSIBILITIES

A market that experiences a climatic selling frenzy can often generate hyper-sold conditions which merit for a rally, but not one that is sustainable to recover from such severe technical damage. Instead what occurs is prices fall back at minimum to retest the prior low, but the decline in motion is not nearly as dramatic. Thereafter becomes a scrimmage between both buyers and sellers until a general support area can be agreed upon, and to where the next bottom can then be established.

Currently, the U.S. Dollar index does not at all reveal any convincing price action that is worthy of a true bottom. This has significance because many asset classes within the stock market respond inversely to the performance of the greenback currency.  Essentially by knowing the dollar’s next move can better prepare your analysis in other markets.

Take for instance the Daily chart I have below.
I expect this current bounce within a panicky decline to fulfill another low here within the next few weeks. Following what should culminate into a basing period, I anticipate a counter trend rally to emerge and set the stage for a corrective move in both stocks and commodities.
Bonds:
I don’t’ think I am stating anymore than the obvious about their being a major top in our U.S. Bond Market. The Federal Reserve clearly surprised many investors with the purchase of mortgage back securities, and not U.S. treasuries as was done with QE1 and QE2. Consequently, this holds very little incentive for bond holders to continue purchasing U.S. Debt and will likely look elsewhere to reposition at least until now through the election.

The technicals imply that prices have materialized into a classic Head and Shoulders formation, but more importantly, generated a decisive downward break of the long term cycle trend-line that for many months held as previous points of major support. The occurrence of these two specific bearish events structurally classifies our U.S. Bond Market as being in a confirmed downtrend.
Above all else, you should know that for any asset class- be it bonds, stocks, or commodities; all are driven by only two specific fundamental principles. How much liquidity is available, and how much of that liquidity is willing to be invested.
Emerging on the scene is a three headed monster that will eliminate all fears of liquidity ever running dry between now and year end. It being- the flight of capital from Europe into the U.S. Markets, the intended inflationary tactics instrumented by the Federal Reserve, and the outflow of money from U.S. Treasuries into undervalued sectors of the stock market.
I think at this point we can safely say that all bearish bets are off the table, for stocks that is. And nearly every broad market average index is on the verge of ascending to new all time highs, re-confirming the very expectation I outlined in post titled, “Are we to Blame Nixon.”
Stocks:

At the moment, however, the Stock market is likely looking at a consolidation period very similar to the month of August before it resumes its advance higher.
Since the Federal Reserve called to a halt a forthcoming grueling market decline by announcing its new supportive stance on aggressive monetary policy, I think it’s time that my longstanding target of 1565, give or take 20 points on the S&P 500 will come into fruition in the months ahead.
But when I say 1565, we will be so close to the previous 2007 bull market highs that the political incentive to send prices to new all time highs is more likely. This would create an even bigger illusion of both “the richer effect” and a true economic recovery.

Monday, September 17, 2012

Flirting with a new Paradigm Shift


It has been my long expectation that the Federal Reserve would uplift a sagging financial system by way of injecting more liquidly into our economic bloodstream.

On Thursday September 13th, Fed Chairman Ben Bernanke announced Quantitative Easing 3, initiating the purchase of 40 billion dollars in mortgage backed securities per month on an open-ended basis.

A mechanical breakdown of this style of Keynesian economics is quite intricate, so I will explain only one chapter as it relates to our current fiscal model of growth.

Essentially by keeping rates at suppressed levels, homeowners are provided with the incentive to refinance their existing mortgage rate. A lower rate will in turn cause you to pay a lesser amount per month on your mortgage.This money that you save will in theory be used to spend on products and services offered by the very companies that create jobs in this country.
But as you know, any company with the purpose to accumulate generational wealth must be equipped with expanding profit margins and increasing revenue streams over long durations of time. This criterion is only possible when consumer demand is present.
The problem is that our current demographics do not quite support this natural cycle of demand. The baby boom era still remains a large part of our population, and many of them are either living on a fixed income or exiting the work force. Plus you throw in the fact the rate of inflation is not keeping pace with their pay checks and you have a recipe for disaster.
So companies that benefit from the short-term effects of monetary easing are only profiting from an economically self defeating model which artificially compromises the absence of real demand.
Therefore you will always have pockets of society that get left out, causing the poor to get poorer and the rich to become richer. This development creates an even greater separation of socioeconomic classes over time.  

Wednesday, September 12, 2012

Resting on the Bernanke Decision


 Often is the case that the dollar will reverse just before or within days of a major anticipated news event. If I'm right, today's potential bottoming tail candlestick just shy of the Fed’s announcement tomorrow may be an indication of a Bernanke disappointment. On this basis, the dollar has bottomed and will likely undergo a sharp upward reversal into the remainder of this week.
If however the market likes what it hears since now days language itself is a measure of stimulus, then expect to see a sharp 1 to 2 day downdraft which will finalize this current decline.
Either way, I do not expect this deeply oversold condition to at all  be making any accommodations for QE3 tomorrow, or anytime soon for that matter.
 

IF the dollar does drop another day or two, Gold will likely make an advance to psychological resistance at 1800 before marking a short-term top.  Otherwise, a top is in, and prices should initiate into a corrective phase over the next 3 to 4 weeks stalling at its 50 day moving average.
I also want to emphasize that this upcoming pullback should reside anywhere between 1650 and 1700, but it may be the very LAST time this year we ever see the metal price trading here again. The reason being is a soon glory cross that will confirm the re-emergence of a new bull market.
 
Say what you want about moving averages, but they seemingly have provided as a worthwhile indication of trend changes throughout history. And while no indicator is perfect, judging by price alone, the yellow metal has certainly been acting very strong lately.
I expect by mid October this cyclical turning point will be within a larger framework of drastic inflationary measures pursued by all nations to artificially revive their homeland currencies. Consequently, Gold will materialize into a hyper-inflated market that decouples dramatically from all other asset classes.
Remember, 95% of people are not actually convinced of a GOLD BULL until the trend is in its latter stages. And only then does it become too expensive to buy. The only arguable explanation that would end the bullish case is until real rates surpass one, or at least when the public figures out that those levels can be realized.
I don’t see that happening anytime soon, do you?


Friday, September 7, 2012

Gold and Silver

We are currently witnessing a short-term commodity run that is wildly bullish in both sentiment and price. Suffice it to say, these pivotal times where Investors ignore risk, and are overconfident in their decision making actually mark key turning points.
Gold and silver have underwent a parabolic move, riding on the back of expected further easing from our Federal Reserve. This I can tell you will dissapoint many investors.
Consider this analysis.
All metals are now more overbought than their previous peaks of months prior. I would not see this as a concern had this just been on a daily chart, but it’s clearly visible now on the weekly chart.
Silver
 
Gold
 
This condition certainly adds weight to the bearish case in the coming weeks.
We may have a little more room to run for the very short-term, however, it would be unwise to overlook a pullback or even deeper correction looming just ahead.

Thursday, September 6, 2012

September 6th Market update


Stocks:
What’s the worst thing that could happen?
The Dow and S&P go to a new high and form an even larger megaphone bearish reverse wave top.
The market is evidently defying gravity that for many has been psychologically unbearable, and unexplainable. The answer is a purely manipulated market.
The deep pockets on Wall Street are squeezing out every last penny in the remaining glamour stocks. Most of these “dogs” are trading for at least a 15% premium, and even within in a thinly traded market, it still is liquid enough to jam the shorts to new recovery highs.
S&P 500 Daily Chart 
 
I should also point out that the recent narrow range trading days have brought about a fairly oversold condition. The implication is that prices are likely to be within a bullish consolidation. SO, a potential rally from here may warrant a PRIMARY trend change at roughly 1430-1450 before the final 5th wave is complete.

Preventing any catastrophe, the only evidence that would negate this stated bullish possibility is a confirming move below 1380 on a weekly closing basis.
 
S&P 500 Weekly Chart
Historically, when broader internal indicators are not only overbought, but diverging, you are basically WAITING for an intermediate decline.
The downward expectation has so far been totally absent and the fact that the market continues to defend the 1400 level is suspiciously bullish.
We know the downside risk overrides this immeasurable bullishness eventually, but until we see a steeper sell-off, the bulls remain in control.
Crude: 
Crude Oil will be one to watch. It moves in tandem with the market, but neither stocks nor the economy can withstand higher prices at the pump, at least not at this rate.
Crude Oil- Daily Chart
If oil can push a bit higher, it's less likely the market can sustain a strong upward advance. That’s why I think if there is one last hurrah in all markets, this has the potential to be it.
VIX:

 
The VIX being already overbought does not quite suggest a market top either. There is potentially a Head and Shoulders Top on the hourly chart that could allow more downside.
VIX- Hourly Chart
In my opinion, it will hold above the 13.30 level and set up a buying opportunity. This scenario would create a divergence between equities and the VIX, marking a likely reversal point.

Saturday, August 4, 2012

Weekend Video Update


First click on the video so that it plays, then double click to bring to full screen.

Saturday, July 14, 2012

PREMONITION!

The broad market averages are now revealing overwhelming evidence that a significant top is upon us. And in the coming weeks, I fully expect the world to witness a dramatic downturn that sends prices into an abyss.

Get ready Folks, as this upcoming event will be a force not to reckon with, and for those who deny such could suffer major losses in their investment portfolio.

You might recall in my last post, "Are we to Blame Nixon," I specifically warned readers to stay away from an imminent short covering rally that would emerge, but not to give credence to its illusion of a renewed uptrend.

Unlike most short covering rallies, this one has been all but convincing. It fell short of fullfilling the reek of euphoria in the marketplace, and barely neutralized the negative senitment that engendered during the previous decline in May.

The market is now on the verge of resuming its bearish downward momentum, and the reacceleration of this current decline will categorically be one of much greater magnitude. Stocks will undergo an aggressive sell-off that generates fear and anxiety among investors of every description. This liquidation process will lead to capitulation, where neither buyers nor sellers desire to participate in the marketplace.

My best guess is that this momentary spark in equities will soon fizzle out and stocks find their breaking point sometime between now and the next 10-12 trading sessions. This scenario should materialize in a crawling-like descent, much like the one last week, followed by a 3-5 day mass exodus.

S&P 500- Daily Chart


Saturday, May 26, 2012

Are we to blame Nixon?

The Fundamental forces driving this market higher for the short term is partly due to the expectation of QE3. Ben Bernanke will ultimately prime the printing pump again, but only after we see the selling pressure intensify.

There is still plenty more downside left of this market, which is why I'm telling you not to believe this current rally. It is simply a contra-trend within a larger decline, but only for the intermediate term.

What do I mean by that? While there are those per-ma bears who feel we are doomed for a deflationary environment, and on this basis, prices will likely head south to retest the march 09' lows. Folks, there is still plenty of evidence that suggests this is only a mild correction within a larger bull market.

Here are several things to consider....

Ever since President Richard Nixon eliminated the gold standard, the value of money is determined by a basket of currencies. This means the value of our dollar is at the mercy of central banks, and believe me, their priorities are to pay back sovereign nations with cheaper money. This will alleviate them from their enormous debt obligation, but also achieving something much worse- destroy the purchasing power of your bottom line wealth.

The Federal Reserve has made it clear that they will do whatever it takes to avoid another 08' collapse, and now more than ever are firewalls in place to prevent such from happening.

Think about it.  For the past year the Market has been masking several dramatic developments that could have, and should have led to catastrophic consequences.  They were- the bankruptcy of M.F. Global, J.P. Morgan's announcement of a $2 billion dollar loss on risky credit derivative bets, and the growing magnitude of Europe's economic contraction.  Yet the market shrugged it off like a bad case of flees.

And I should also mention that only a handful of Market Indices in the entire world have managed to decisively clear above their previous 2011 highs. I'll give you a hint, they all trade in the United States. Why do you think that is?

You see, the U.S. dollar still holds the World Reserve Currency status, and by default, is considered a safe haven to other international currencies. For this reason, citizens of Europe have been taking money out of their home land (real estate, banks, European stock market, etc.) only to re-allocate these funds where the return on investment has a more promising outlook.

We are beginning to see the early stages of this process come into fruition. However, the question that remains is where exactly will all this money go? It can't all go into the Dollar, nor can it all go into gold. It will spread throughout every asset class of the Stock Market , and consequently, re-inflate stocks and commodities to new all time highs.


 S&P 500 v. U.S. Dollar


S&P 500- Daily Chart


Silver- Daily Chart


The U.S. Dollar- Daily Chart

Gold- Weekly Chart


 GDX- Weekly Chart